Distribution of Temperature
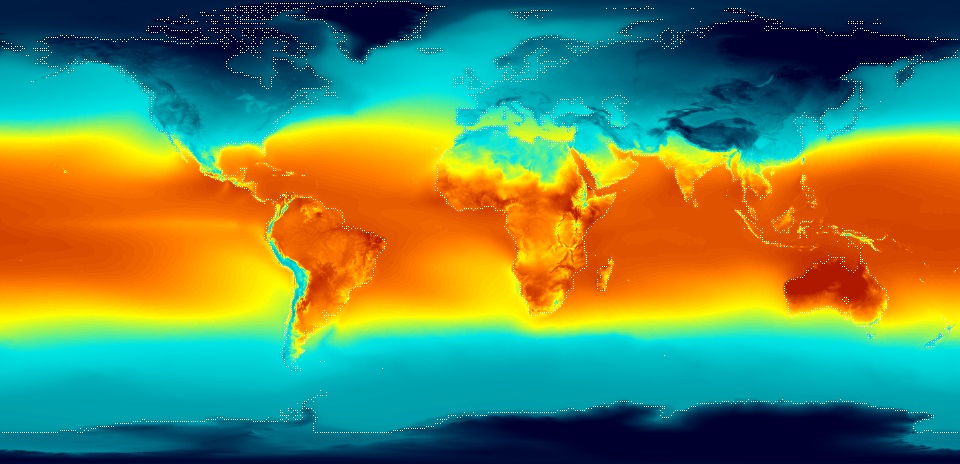
The global distribution of temperature can well be understood by studying the temperature distribution in January and July. The temperature distribution is generally shown on the map with the help of isotherms.
Isotherms geography
The Isotherms are lines joining places having an equal temperature. In general, the effect of the latitude on temperature is well pronounced on the map, as the isotherms are generally parallel to the latitude.
The deviation from this general trend is more pronounced in January than in July, especially in the northern hemisphere. In the northern hemisphere, the land surface area is much larger than in the southern hemisphere.
Hence, the effects of landmass and the ocean currents are well pronounced. In January the isotherms deviate to the north over the ocean and to the south over the continent.
This can be seen in the North Atlantic Ocean. The presence of warm ocean currents, Gulf Stream, and North Atlantic drift, make the Northern Atlantic Ocean warmer, and the isotherms bend towards the north.
Over the land, the temperature decreases sharply and the isotherms bend towards the south in Europe. It is much pronounced in the Siberian plain. The mean January temperature along 60° E longitude is minus 20° C both at 80° N and 50° N latitudes.
The mean monthly temperature for January is over 27° C, in equatorial oceans over 24° C in the tropics and 2° C – 0° C in the middle latitudes and –18° C to –48° C in the Eurasian continental interior.
The effect of the ocean is well pronounced in the southern hemisphere. Here the isotherms are more or less parallel to the latitudes and the variation in temperature is more gradual than in the northern hemisphere.
The isotherm of 20° C, 10° C, and 0° C runs parallel to 35° S, 45° S and 60° S latitudes respectively. In July the isotherms generally run parallel to the latitude. The equatorial oceans record warmer temperatures, more than 27°C.
Over the land, more than 30°C is noticed in the subtropical continental region of Asia, along the 30° N latitude. Along the 40°, N runs the isotherm of 10° C and along with the 40° S, the temperature is 10° C.
The highest range of temperature is more than 60° C over the north-eastern part of the Eurasian continent. This is due to continentality. The least range of temperature, 3°C, is found between 20° S and 15° N.
Horizontal and vertical distribution of temperature
Horizontal distribution
The distribution of temperature across the latitudes of the surface of the earth is called Horizontal distribution. The most basic horizontal temperature variation is the decrease in air temperature slowly from the equator towards the pole.
Vertical distribution
This is the distribution of temperature in the different layers of the atmosphere at the different latitudes from the earth’s surface. The temperature slowly decreases with elevation (Increase in Height).
This vertical distribution of temperature, also the pressure, density, and composition of the atmosphere constitute the atmospheric structure. The decrease in temperature with an increase in height is because the air cools as it expands into lower pressure regions, but this does not happen everywhere.
This distribution is characterized by the vertical temperature gradient γ, which is expressed in degrees per 100 m. In the troposphere, the temperature decreases with height at an average rate of 0.6° per 100 m—that is, γ = 0.6°/100 m.
That is the average rate of temperature decrease upward in the troposphere is about 6 C per km, extending to the tropopause.
Factors controlling temperature distribution
Latitude, Distribution of Land and Water, Prevailing Winds, Ocean Currents, distance from the sea, altitude, etc.